Today I encountered this question on stackoverflow. It asks about monitoring tools to run locally because they cannot share credentials with third parties. (like Observu) This comes with the disadvantage of now having to take care of the reliablity of this script, making sure you receive alerts if anything goes wrong and storing historical data for later root cause analysis.
As this is a problem that is very relevant to our users as well, I will expand on the problem a bit more. First, if possible, the best approach would be to provide monitoring with a dummy user that has no sensitive data in their account. This is often possible if you are running an account based service, where data is owned by the user that is logged in. If that is not possible, I can think of a few solutions to keep your passwords or API credentials to yourself, while still using a remote monitoring service:
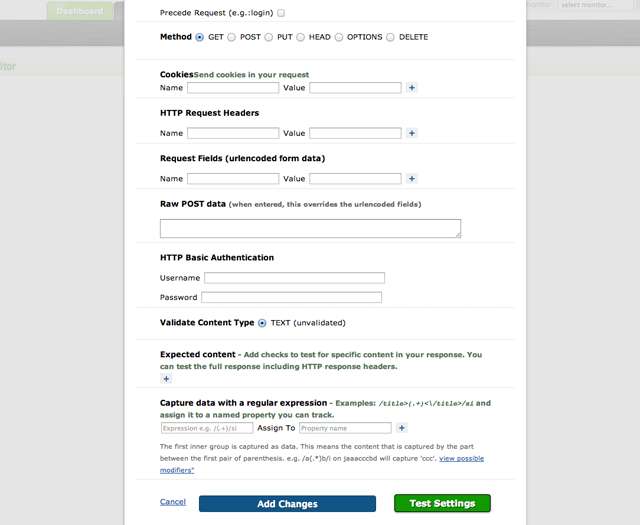
- Create a separate page on your website, that executes all critical operations, but just does not provide any relevant content as a result. e.g. just have it output a keyword and a status for each operation if it succeeded. You can then have a remote monitoring service call that page and use regular expressions to parse out those keywords and collect the status on each one of them as individual data.
- Similar would be to use the language that you are building your website in to call it’s own URL’s and do the regex parts and again build a status overview. This however does come with the downside that the URL’s are called locally, so firewall rules, etc. may be different than for a real user
The other way would be to run just the part that calls your website on your own VPS (or preferably multiple ) that you can secure the way you like. And send the results to the API of a monitoring service like ours (https://observu.com/docs/api) The script that does the actual fetching, querying and testing it with regular expressions can be in any language you are comfortable with. (Or you can just take the results of calling JMeter)
The advantage here would be that you call your scripts from multiple remote locations, while still keeping control of the passwords. (Given that you either have your own datacenters remotely or trust at least Amazon or any other provider enough to have your passwords in a small virtual instance)
If you are interested in this approach, we are very willing to provide you with assistance in setting this up. Just send an e-mail to our support department outlining your case and we will point you in the right direction, providing ready-made scripts when possible.