We have chosen to discontinue Observu.
If you are looking for website monitoring, we recommend UptimeRobot.
We have chosen to discontinue Observu.
If you are looking for website monitoring, we recommend UptimeRobot.
With single page apps, checking whether the page is served by the server is not really sufficient to ensure a customer sees anything. However, with a little extra effort you can still monitor these pages effectively. I recommend three different angles to your monitoring strategy: a simple HTTP check, a full browser check and an API check.
Although not much can go wrong with a static page, it’s still important to monitor it. HTTP status monitoring is the quickest way to know about configuration issues with e.g. SSL certificates, DNS and your web server.

A single page app relies heavily on JavaScript, it is therefore essential that no resources are missing or syntax errors got in. Furthermore, there may be third party resources that are essential. We can cover this by loading the page in a headless browser (every 15 minutes) automatically and making sure all resources are loaded and no JavaScript errors occur. Furthermore you can monitor the time it takes for the page to actually load. Load time is important for user experience and SEO.
To make sure a single page app does not only load, but can also show useful information quickly, it is important to also monitor the API that it calls. We strongly recommend monitoring not just a static /ping endpoint but an actual major endpoint that requires a logged in user. (assuming you require users to log in). An example could be a listing that is part of your home/main screen.
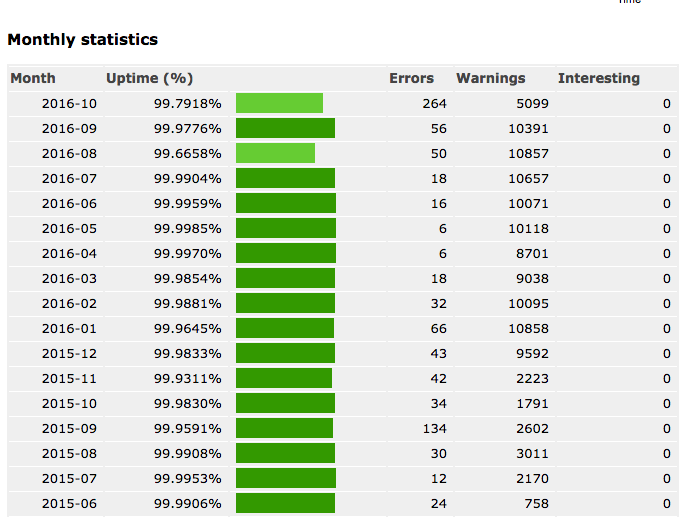
Observu has long enabled you to view uptime over past 24 hours, 30 days and year. As well as view day-by-day uptime over the past week, month, quarter or year. However we were missing a month-by-month report of uptime to see more general trends.
We’ve listened to our client feedback and added a new monthly summary report to the ‘Uptime Reports’ page of your monitors.
We are also working to add more advanced uptime statistics to other reports. If you have any suggestions on stats you would like to see, please let us know.
Last week we release the first version of the Observu App. The app lists current and most recent incidents for a quick status check. If there is anything actionable, those items will be prioritised on the home screen.

The main feature to install the app for is the ability to receive push notifications. These can be set up in the same way as our other notifications, with configurable thresholds and intervals.
The app has been implemented in C# using Xamarin.Forms, allowing for quick cross-platform development. Push notifications are powered by Amazon SNS.
You can download and install Observu for iPhone and iPad – Observu for Android
We plan to quickly extend the app to also include detailed reporting regarding current status and historic data. We welcome all feedback.
As a developer, I don’t particularly enjoy customer support. Questions are either about things that are obvious (or should have been) or about things that I don’t have a clue about either and need a lot of investigation. Some customers are just plain rude with “it’s not working” in the subject and nothing else.
At first sight it seems to be a huge waste of your expensive developer time to spend time on this. However, I strongly believe you should. (And this holds for everyone involved in the development of your product, not just the ones that write code)
Users don’t always know how to ask the right question. A developer that actually understands the technology and implementation of your product is much more able to aks the right questions for clarification. In this way you prevent a lot of unnecessary back and forth of irrelevant questions before escalating the problem. No matter how well you’ve trained your support staff, a customer can always tell if you asking standard questions.

There is no-one better at actually telling you how you supposed to use a system than the person that built it. Even if you can’t solve the issue immediately, telling a user what actually went wrong will make them feel like their input is valued and taken seriously. Furthermore, many issues can be resolved on the spot or worked around, instead of having a ‘escalated to the tech department’ and waiting for a week for a follow-up. Users will notice a personal response with actual substance and will turn them into your most loyal customers.
As a developer, it’s easy to get lost in just crunching on lists and lists of features and bugs. Product development is not a vacuum. There is no better feeling than actually solving a problem for a customer and being able to answer them that the issue is already fixed. Being in touch with customers will help fuel ideas about new features to make life easier for everyone involved.
The most powerful action a developer can take is to actually prevent the question from re-occuring. Of course bug reports will get to the developers independent of whether they answer the reports directly. However, there is more to support than bug reporting. The standard way support will deal with re-occuring questions is to provide canned responses. Instead of that a developer should be able to take away the root cause of the question even if it is just by providing some extra help information in a form.
One of the hardest problems for developers is to get a feel for priorities if your backlog grows faster than you are ever able to cross items off. Of course you need someone managing those priorities from a business perspective, but there is a difference between your product owner telling you something is important and to actually feel it is important. Interacting with customers can greatly improve this internal compass.
Disclaimer: I’m not talking about phone support, that might be too much of a disruption. However checking and answering support tickets a few times a day can be worked into anyones schedule.
Observu has been discontinued
Try UptimeRobot