We are getting closer and closer each day, we are almost ready for the first bunch of testers. Our attention is shifting more towards the user interface, to create the best experience possible.
An important part of that user interface are the graphs, that start to look better and better. An example is this stacked CPU usage graph:
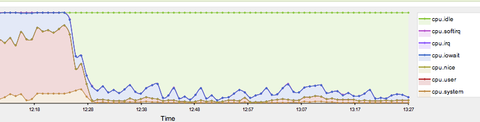
This also shows an other major point of progress: we now have a fairly easy to install daemon script to collect this data on linux servers. Currently it collects load, cpu, memory, disk and network statistics. We are planning on collecting a whole lot more soon.
The final part of this months effort is a mobile website. It provides with a simple and clear way to check your site and server status on-the-go. For example, when you receive a text notification, you can instantly check what is actually going on.
We feel confident that we can allow the first testers access next month and are really looking forward to their feedback. To make sure, you can be one of those testers, sign up for our mailing list!